Light the Candles
Authored by: @hetty-rowan
The Candles talk to you!
As I mentioned last week, it is advisable to get a little basic knowledge of how to read a chart with Candlesticks. Regardless of whether you want to trade yourself, it is also nice if your basic knowledge of the market, and how interpreting all the information contained in these candlesticks, can determine the right time to determine the coin you are going to. looking to buy or sell.
Buy the dip, or miss the flip
It is nice if you can estimate a bit where a possible dip will end up so that you do not buy too high, but it is just as nice if you can estimate where a possible peak will end so that you can take the full profit in that peak and does not sell too quickly. Now I am not claiming that reading Candlesticks you can see everything. That is not the case. Certainly not. In addition to the Candlesticks, you certainly need other technical indicators to be able to do more with this. But you can tell from the Candlesticks whether a market is Bullish or Bearish. These Candlesticks show you a clear story in it, and each Candlestick gives you information about it.
Learning about the Candles
Lately I have been cautiously entering the market to learn how to trade better. For that it is of course necessary that I would also take in some technical information, because only trading on the principle of Buy Low, Sell High is nice… but it does not really work well when the market shows strong fluctuations. It is extremely stressful that way, especially if you have no insight at all about what the expectation is in the longer term. And how high can you put the Sell order in the market, how low can you put a Buy order. Of course, it doesn't make sense if the market is very bullish, and you don't see that, you think, “Oh wow, I sell 10 euros profit NOW and put a Buy order 200 euros lower because then I have a lot more”. That way you miss out on a lot of profit, and you can cut yourself in the right direction. Conversely, if you do not realize that the market is bearish, it can cost you dearly, and you can lose quite a bit if you do not sell because you think it will soon go up again. Now there is no real loss when the price recovers, but at such a moment you could still have a good ride on a 'Buy the dip' movement. If you had known that the price would drop quite a bit when you started selling.
I've been on both sides
And believe me, over the years I have tried to trade more often, and with a lot of stress, and with a lot more luck than wisdom being able to grab a little profit now and then. But also just as often see my hard-earned cryptocurrencies evaporate due to the volatility of the prices. Where I could have made a lot of profit IF I had only had the insight into the Candlesticks and the other technical indicators that help with this. Because, I have to add that, learning to read and understand is a good thing to do. But no 100% guarantee that you can never lose again. We must not forget that. Ultimately, it remains a story of supply and demand, and yet the buyers and sellers largely determine what happens to the price.
Well, a long introduction in which I think I say the same 4x… now really on with the Candlesticks.
Because what are they actually telling us?
We now first dive into the different types of Candlesticks. And to understand that, you need to know what exactly those Candlesticks are telling us. You know those things… if you are going to trade in an investment product you will see those red and green cubes in the price chart. They can vary in shape from a straight bar, to crosses, but they always contain information for you. Candlesticks are essential for successful trading. A candlestick is a kind of mini graph that shows the highest price (high), lowest price (low), opening price (open) and closing price (close) of a cryptocurrency within a certain period. These are used to predict which direction the cryptocurrency price will (most likely) go. The period over which the candle shows this can vary from 10 seconds to many years. Having a good grasp of candlesticks will make it a lot easier to decide when to buy or sell a crypto.

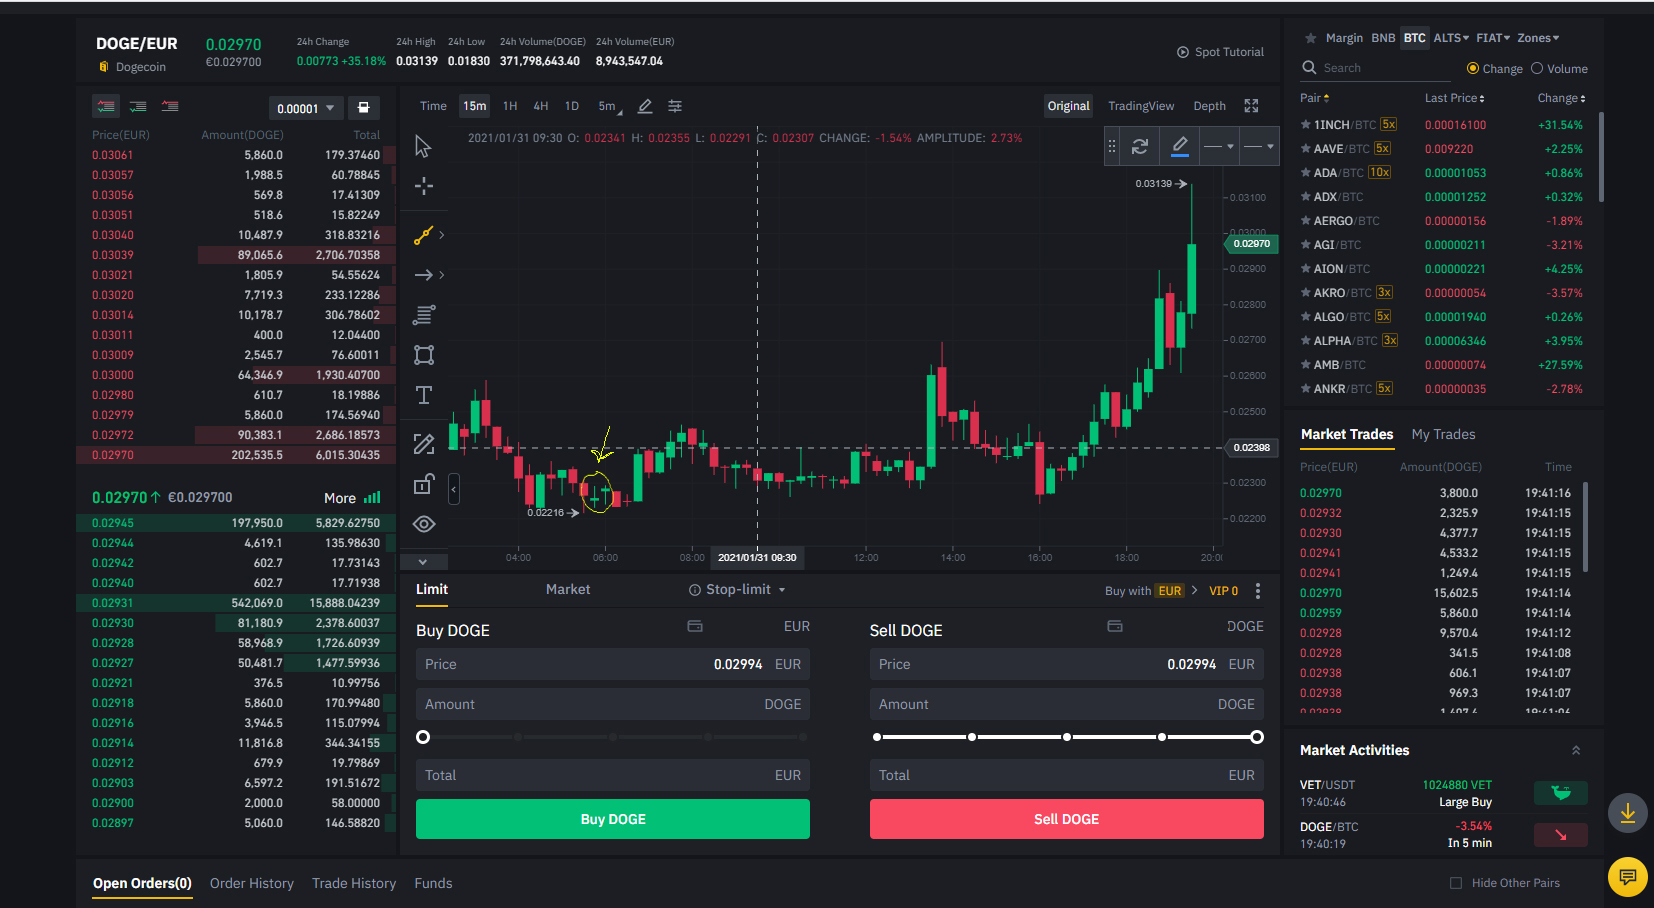
I choose to show you a DOGE chart because it was hot topic for the last days
Red and Green
You have green and red candlesticks. A green candlestick means that the price has gone up, while a red candlestick means that the price has gone down. With a rising price (and therefore a green candlestick), the high (the highest price within that period) is displayed at the top, with the close (the price of the cryptocurrency at the end of the period) below. At the bottom, the open (the price of the cryptocurrency at the start of the period) with the low (the lowest price within that period) below it. With a red candlestick, the "open" and the "close" are logically the other way around (falling price means that the price closes lower than it opens). The "stalk" from the very top of the candlestick to the very bottom thus shows the price range of the relevant period.
- High: The highest value of the cryptocurrency within the period
- Low: The lowest value of the cryptocurrency within the period
- Close: The value of the cryptocurrency at the end of the period
- Open: The value of the cryptocurrency at the beginning of the period
What information can you get from this?
The information you can get from candlesticks are mainly "chart patterns" or chart patterns. Candlesticks can signal whether a trend is continuing in the same direction or not.
Therefore, a distinction can be made between three patterns:
- Continuation: The trend continues in the same way
- Indecision: It is not clear which direction the trend is heading. Buyers and sellers both seem to pull the course equally hard.
- Reversal: the trend is turning. The price goes from falling to rising or from rising to falling.
The 4 main candlestick patterns
There are a lot of candlestick patterns that can indicate what is going to happen to the price, but an entire article can be written about that in itself. For now I will limit myself to what I have been told what the most important and powerful patterns should be.
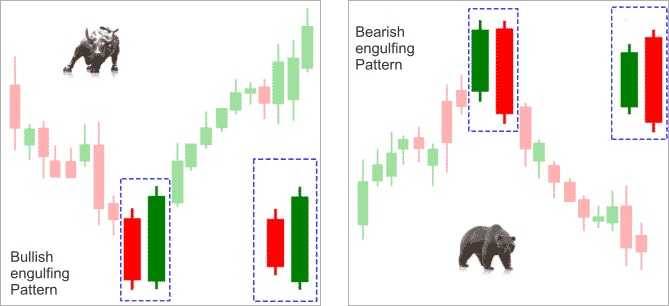
Bullish Engulfing (Bridging) Candlestick
A bullish engulfing candlestick is formed when the price of a cryptocurrency within a certain time period has been both higher than the highest price of the previous period and lower than the lowest price. It bridges (engulfs) both prices. This pattern basically shows that the price of the cryptocurrency has gone down, but has found support here, making a bullish upward movement back to break the high of the previous period. This candlestick is often the sign of an upward trend change.
Bearish Engulfing Candlestick
The bearish engulfing candlestick is logically the opposite of the bullish engulfing candlestick. In this case, it also bridges both the high and low of the previous period, but the close is lower than the open. This candlestick can occur at the top or within a trend, which signals that the trend will continue downward.

Hammer Reversal Candlestick
This candlestick mainly occurs at the bottom of a downtrend or at the top of an uptrend. The candlestick owes this name to its shape; it is very much like a hammer. When you come across the hammer reversed hammer candlestick, it could be a sign that the trend is about to reverse. The longer the "handle" of the hammer, the more this indicates that the market has tested the support of resistance. After this "low" or "high" has been tested, the bulls (traders who think the market is rising) or bears (traders who think the market is falling) take over again and a reverse trend can be expected.
DOJI
A Doji candle shows indecision in the market. It is not clear whether the market will rise or fall further. These candles have the shape of a cross. At this point, bulls and bears are battling each other out which way the market will go. The Doji candlestick therefore has a small body (with the open and close close together) and a somewhat longer "stem". With Doji candles it is usually not a good idea to trade because the market can go up and down from that point on. It can, however, be a clear indicator of a signal that the market's sentiment may change.
These are not the only Candles
There are many other candlesticks that can send a signal, but I am not even that far in my learning process, and that it is quite a learning process may be clear. Still, I have already made a nice start with these four, and you can already get ahead with these four Candlesticks. In any case, the graphs become a bit clearer if you keep this in mind. And at least you know a bit more WHAT these Candlesticks are telling you anyway. It is a fact that these candlesticks only give a very little information, and you should always use this in combination with other indicators such as volume and chart patterns.
Continue to learn
I hope that this week I will be able to learn more about this myself, because that is another small step further in my goal to be able to trade profitably by learning to better estimate what a course is going to do ... and what I'm on could bet. In this way I hope to gain more insight for myself, so that FOMO and FUD become a thing of the past.
I would love to hear and learn from YOU
Obviously I hope you have benefited from this too, and I would like to be recommended for more information, because as it may be clear, I have only just started discovering all this and have still a big learning curve ahead of me.

Posted Using LeoFinance Beta
That's some good info, some people use candlesticks for every trade they do. I hate the red ones! lol
Posted Using LeoFinance Beta
Thanks, it can be very helpful to use the candles to try to predict where the price will be going. But it's not the only advisor you have, or should use. I think the red ones are great! They give you the possibility to sell in the top of the green ones and buy more in the bottom of the red ones. Without the red candles how would you get more crypto? It would be soon enough that no one could afford it to buy more.
Posted Using LeoFinance Beta
For the beginer it's hard to understand, but they must keep on learning.
I love the green candles;)
Posted Using LeoFinance Beta
It is not easy, but onse you focus to learn ... it becomes a lot more clear to understand it. I love the red ones, they make it possible to buy more at a bottom. Without red candles not much interesting to trade anyway.
Posted Using LeoFinance Beta
a very well educated post, I did not know the meaning of the different types of candles. However, I avoid trading, so the green candle when I buy becomes red: p
Posted Using LeoFinance Beta
Thank you for the comment. And even if you don't trade yourself ... it's a good thing to watch for red candles to buy at a lower price 😄
Posted Using LeoFinance Beta
Very nice post. Candlesticks tell you alot about the chart. The next thing to learn after that in my opinion is volume. Most of the existing indicators that most people use are also based on price and volume. It take's some time to learn, but it is definitely worth it.
Posted Using LeoFinance Beta
Thank you. Yes volume is very important too, I have to learn about all the technical indicators and volume is for sure one of the most important ones.
Posted Using LeoFinance Beta
Trading is a continuous learning process and it takes a long time to get a grip, someone said it's not about mastery but how much money you're making especially if you're day trading
. The red and green is actually the only indicator I know and sadly nothing else.
Posted Using LeoFinance Beta
It is indeed a learning process, but a process that can be very much worth it to learn. And believe me, if you lose money because you don't know where to look at, you will try to learn. Red and green are indicators, but more important is the information they provide you ... you have to try to think ahead and the indicators there are can all help you to interpret that and it can be very helpful to make more.
Posted Using LeoFinance Beta
I enjoy your articles, they're very articulate and resourceful for by all standards.
Posted Using LeoFinance Beta
I like how you've focused on reversal candles such as dojis and engulfing patterns. These are probably the two most straightforward patterns that a price action trader should pay attention to.
Just remember that candle patterns alone only indicate indecision. But when you add greater context such as the overall trend or support/resistance zones, this is when they can indicate an impeding reversal.
If you're looking for some further reading here on LeoFinance, check out my forex support and resistance trading strategy which includes sections on how to read price action (candle patterns) around key zones.
Posted Using LeoFinance Beta
Thanks for the link, I will make sure to save it and look into this. Yes candles are not the only information you can or should rely on. And I will have to wrap my brains around the other things too. It takes time, but I'll get there ...
Posted Using LeoFinance Beta
im such a lazy guy that i really dont care about looking at charts when i invest in something, basically i dont care about the price but the value of the project, utility, etc
i tried to learn about candlestick patterns but again im too lazy and bad for trading xD!!
so in my case value > price
Posted Using LeoFinance Beta
That's nice if you think about it that way, and don't bother to trade anyway. But for me trading is the way to make some more, I can't afford it to buy, so trading is one way to make more.
Posted Using LeoFinance Beta
oh yeah trading its cool! im doing some scalping from time to time but nothing particularly professional haha im just experimenting
Posted Using LeoFinance Beta
I am always trying to learn more about trading, it's a very interesting topic for me and this post was wealth of knowledge . Thank you
Posted Using LeoFinance Beta
You're welcome. I'm learning this as well, and writing about it is a good way to understand more of this myself.
Posted Using LeoFinance Beta
Technical Analysis was never my thing but If could read the whole piece, it means you got me interested enough. Now I finally understand about the damn candles. Cheers.
Posted Using LeoFinance Beta
Well that's a nice compliment to read. Thank you ... and happy that the candles lit up for you now. Cheers!
Posted Using LeoFinance Beta
Sorry i want to ask is LBI another LEO Token? And how to get the LBI? Its buying from Leodex?
Posted Using LeoFinance Beta
LBI is not a LEO token. LBI is a token that is backed by LEO what means that for 1 LBI that is issued at least 1 LEO is staked in the @lbi-token account. 1 LBI is worth at least 1 LEO, but at the moment LBI is already worth more. If you read the first posts from this account you can find all the information you need about LBI. You can buy LBI directly from @lbi-token by sending LEO. For every 1.10 Leo you get 1 LBI.
Posted Using LeoFinance Beta
thankyou @hetty-rowan for the explanation, i can conclude from your explanation its similar like Hive and HBD right?
Posted Using LeoFinance Beta
thanks for sharing this info about candlestick and all. I for one would love to learn more and trade crypto. hopefully I get become a pro in all this someday
Posted Using LeoFinance Beta
Lol, later when we grow up ...
Well I hope you manage to get there soon. But it is a learning process for sure. It takes time, determination and a lot of practicing, and believe me, if you lose a few times ... the determination to master it grows fast.
Posted Using LeoFinance Beta
True. I'll get right on it by practicing daily
Posted Using LeoFinance Beta
Thanks for sharing this @hetty-rowan, this was a good and informative piece. Cleared up something I guess I've misunderstood for a long time — I always thought the color of the candlestick was determined by net up/down volume not by price change, which is why you sometimes can find red UP candles, but I stand corrected... nice to know that!
I don't use TA very much, but it's good to have at least a basic understanding!
=^..^=
Posted Using LeoFinance Beta
That was my opinion too, even if you don't use it ... the basic understanding is never a wrong thing to have. And very happy I could clear up some things for you. I didn't know that those candles could tell me so much before I started to read all I could find about it.
Posted Using LeoFinance Beta
Useful update, @lbi-token.
Posted Using LeoFinance Beta
Thank you @wiseagent.
Posted Using LeoFinance Beta
Congratulations @lbi-token! You have completed the following achievement on the Hive blockchain and have been rewarded with new badge(s) :
You can view your badges on your board and compare yourself to others in the Ranking
If you no longer want to receive notifications, reply to this comment with the word
STOPTo support your work, I also upvoted your post!
Check out the last post from @hivebuzz:
A must read post for beginners...
Thanks for sharing...
Thank you for reading and your comment
Posted Using LeoFinance Beta
Thank you again for the well prepared post.
This candlesticks help to understand the movement. For the beginners it is recommended to watch them and learn the patterns as one of the first lessons in trading. Like in ancient Greek, a lot of years of learning and observing for scholars even before the first attempt on something.
Posted Using LeoFinance Beta
I tried trading before, and I admit, I had absolutely no clue where to look at. And no clue how I could see where something was going. This basis of understanding helped me already. And I know that I'm far away from mastering to read the candles. But it's more interesting once it starts to make sense ... and you can see for yourself that it actually can help you make some more money. No matter how big the amount is, the satisfaction is great once you see that you start to understand it. And that gives confidence for the future. And motivation to keep learning more ... and about the other technical indicators you have to know about for succes in trading.
Posted Using LeoFinance Beta
I barely got time to try to earn some Leo, if I would be trading I would be broke as a joke :)
Posted Using LeoFinance Beta
Unless you really know what you're doing and can calculate your risk / ratio reward in a good way. In that way it could make you much more.
Posted Using LeoFinance Beta
do I look like I know what I'm doing ? :)))
And you ask me, a blonde girl ... ? 😋
Posted Using LeoFinance Beta
I ask blonde girls tons of things: if they wanna go out, why did they block me on facebook, why did they call the cops... you know, the usual stuff :D
Ah yeah, I know. Seen it all, heard it all ... Lol.
Posted Using LeoFinance Beta
Thanks for the candlestick initiation !
I don't know if you plan a part 2 but please put in backlog Ichimoku, you can get wonderful results with it.
Posted Using LeoFinance Beta