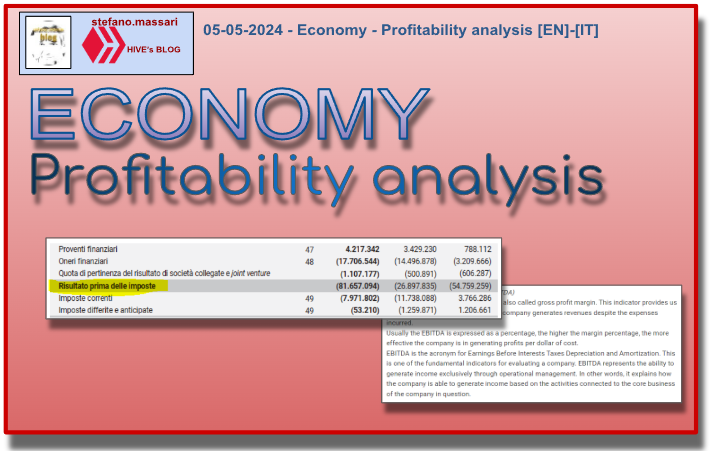
05-05-2024 - Economy - Profitability analysis [EN]-[IT]
~~~ La versione in italiano inizia subito dopo la versione in inglese ~~~
ENGLISH
05-05-2024 - Economy - Profitability analysis [EN]-[IT]
Profitability Analysis
When we look at a balance sheet we can do a profitability analysis.
To proceed with this type of analysis we can take the following things into consideration:
-Gross operating margin (GOM or EBITDA)
EBITDA is the gross operating margin, also called gross profit margin. This indicator provides us with the data that indicates whether a company generates revenues despite the expenses incurred.
Usually the EBITDA is expressed as a percentage, the higher the margin percentage, the more effective the company is in generating profits per dollar of cost.
EBITDA is the acronym for Earnings Before Interests Taxes Depreciation and Amortization. This is one of the fundamental indicators for evaluating a company. EBITDA represents the ability to generate income exclusively through operational management. In other words, it explains how the company is able to generate income based on the activities connected to the core business of the company in question.
-Net operating margin (MON or EBIT)
MON is the net operating margin. This indicator shows us the situation of company profit before financial management. It can also be indicated with the acronym EBIT, which would be the acronym for Earnings before interests and taxes. This means that it shows the profit before interest and taxes are paid.
-Operating income
-Invested capital = budget assets = financial needs
- Balance sheet assets - adjustment funds (operating debts, severance pay fund and short-term debts such as operating and financing debts)
-Own capital = share capital + capital reserves + operating profit
-Return on Investment (ROI) = operating income/invested capital = ROS/CTO = Return to Sale or Operating Income/Capital Turn Over
ROI is also one of the most used financial indicators in investments and marketing. ROI is the acronym for Return on Investment. It shows the return on investment and is a financial indicator that measures the efficiency of an investment.
In other words, ROI allows us to understand whether an investment has generated a profit compared to the invested capital.
-CTO = Sales Revenue/Invested Capital
-Return to Equity (ROE) = Operating profit/Equity capital
-Return to Debt (ROD) = financial charges/invested capital
Example 1
By going to the following site:
https://www.juventus.com/it/club/investitori/bilanci-prospetti/bilanci-relazioni
We can download the Annual Financial Report dated 06-30-2020
In this document we can note some indicators and make a profitability analysis.
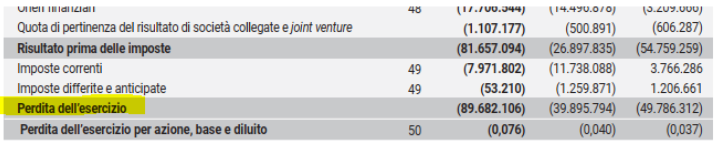
Operating income
On page 31 we have the net result for the year, in this section of the financial statements it is written that the 2019/2020 financial year closes with a loss of €89.7 million. This can also be seen in the income statement on page 49
Below is a screenshot taken from the document reported above
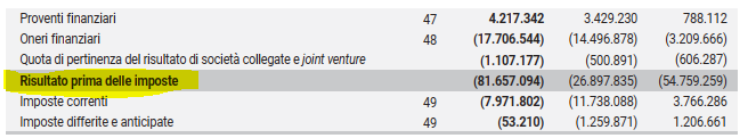
-Net operating margin (MON or EBIT)
Net operating margin is profit before interest and taxes.
The data is found on page 49 and is marked under the heading profit before taxes
Below is a screenshot taken from the document reported above
Example 2
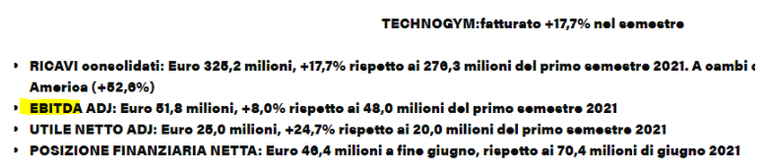
We can take as an example this other site dedicated to Technogym company data
https://corporate.technogym.com/it/comunicato-risultati-finanziari-h1-2022
-Gross operating margin (GOM or EBITDA)
We can summarize the MOL as follows. It indicates what the income of a company is in typical management. characteristic management means: excluding taxes, active and passive interest and every revenue and cost item without any financial manifestation.
By financial manifestations we can mean, for example, devaluations of current assets and fixed assets, or depreciation and provisions,
On this site we see that the EBITDA indicator is shown as the second indicator, second only to consolidated revenues.
Conclusions
To analyze the profitability of a company there are around ten indicators, the most important of which are EBITDA, EBITDA and ROI.
Request
Did you already know the EBITDA, MOL or ROI indicators? When you read a balance sheet, what indicator do you look for to understand whether a company is healthy or not?
![]()
ITALIAN
05-05-2024 - Economia - Analisi della redditività [EN]-[IT]
Analisi della redditività
Quando guardiamo un bilancio possiamo fare un’analisi per redditività.
Per procedere con questo tipo di analisi possiamo tenere in considerazione le seguenti cose:
-Margine operativo lordo (MOL o EBITDA)
Il MOL è il margine operativo lordo, chiamato anche margine di profitto lordo. Questo indicatore ci fornisce il dato che indica se un’azienda genera ricavi nonostante le spese sostenute.
Solitamente il MOL è espresso in percentuale, più alta è la percentuale di margine, più l’azienda è efficace nel generare profitti per ogni dollaro di costo.
EBITDA è l’acronimo di Earnings Before Interests Taxes Depreciation and Amortization. Questo è uno degli indicatori fondamentali per valutare un azienda. EBITDA rappresenta la capacità di generare reddito esclusivamente tramite la gestione operativa. In altre parole spiega come l’azienda sia in grado di generare reddito in base alle attività connesse al core business dell’impresa in questione.
-Margine operativo netto (MON o EBIT)
Il MON è il margine operativo netto. Questo indicatore ci mostra la situazione dell’utile aziendale prima delle gestioni finanziarie. Si può indicare anche con la sigla EBIT, che sarebbe l’acronimo di Earnings before interests and taxes. Significa che mostra appunto l’utile prima del pagamento degli interessi e delle tasse.
-Reddito d’esercizio
-Capitale investito = attività di bilancio = fabbisogno finanziario
-Attivo di bilancio – fondi rettificativi (debiti di funzionamento, fondo TFR e debiti a breve termini come debiti di funzionamento e finanziamento)
-Capitale proprio = capitale sociale + riserve di capitale + utile d’esercizio
-Return on Investment (ROI) = reddito operativo/capitale investito = ROS/CTO = Return to Sale o Reddito Operativo/Capital Turn Over
Anche il ROI è uno degli indicatori di bliancio più utilizzati in investimenti e marketing. ROI è l’acronimo di Return on Investment. Esso mostra il ritorno sull’investimento ed è un indicatore finanziario che misura l’efficienza di un investimento.
In altre parole il ROI ci permette di comprendere se un investimento ha generato un profitto rispetto al capitale investito.
-CTO = Ricavi di vendita/Capitale investito
-Return to Equity (ROE) = Utile d’esercizio/Capitale proprio
-Return to Debt (ROD) = oneri finanziari/capitale investito
Esempio 1
Andando nel seguente sito :
https://www.juventus.com/it/club/investitori/bilanci-prospetti/bilanci-relazioni
Possiamo scaricare la Relazione Finanziaria Annuale datata 30-06-2020
In questo documento possiamo notare alcuni indicatori e fare un’analisi di redditività.
Reddito d’esercizio
A pagina 31 abbiamo il risultato netto dell’esercizio, in questa sezione del bilancio c’è scritto che l’esercizio 2019/2020 chiude con una perdita di 89,7 milioni di €. Questo si può vedere anche nel conto economico a pagina 49
Qui di seguito uno screenshot tratto dal documento segnalato sopra
-Margine operativo netto (MON o EBIT)
Il margine operativo netto è l’utile prima del pagamento degli interessi e delle tasse.
Il dato si trova a pagina 49 ed è segnato sotto la voce risultato prima delle imposte
Qui di seguito uno screenshot tratto dal documento segnalato sopra
Esempio 2
Possiamo prendere come esempio questo altro sito dedicato ai dati dell’azienda Technogym
https://corporate.technogym.com/it/comunicato-risultati-finanziari-h1-2022
-Margine operativo lordo (MOL o EBITDA)
Possiamo sintetizzare il MOL come segue. Esso indica qual è il reddito di un’azienda nella gestione caratteristica. gestione caratteristica significa: escludendo tasse, interessi attivi e passivi e ogni voce di ricavo e costo senza alcuna manifestazione finanziaria.
Per manifestazioni finanziarie possiamo intendere ad esempio svalutazioni di attivo circolante e immobilizzazioni, o ancora ammortamenti e accantonamenti,
In questo sito vediamo che l’indicatore EBITDA viene mostrato come secondo indicatore, secondo solo ai ricavi consolidati.
Conclusioni
Per analizzare l redditività di un azienda ci sono cica una decina di indicatori, tra cui i più importanti sono EBITDA, MOL e ROI.
Domanda
Conoscevate già gli indicatori EBITDA, MOL o ROI? Quando leggete un bilancio che indicatore andate a verificare per capire se un'azienda è in salute oppure no?
THE END
Invested capital = budget assets = financial needs
So actually this is how invested capital works. Now I know better
This is a new topic to me but it’s good to know where invested capital usually leads to
prendere in considerazione se siamo solvibili e redditizi ,ne terrei conto anche nella vita di tutti i giorni.
https://twitter.com/lee19389/status/1787225097939333492
#hive #posh
@tipu curate 2
Upvoted 👌 (Mana: 5/45) Liquid rewards.
!discovery 30
This post was shared and voted inside the discord by the curators team of discovery-it
Join our Community and follow our Curation Trail
Discovery-it is also a Witness, vote for us here
Delegate to us for passive income. Check our 80% fee-back Program
We can do a profitable analysis of a company when we look at the balance sheet.