The 270 Year "WHEN TO GET RICH" Chart | Life Hack!
Hello SPIers, today we look at a chart I saw during the week that got my attention. This chart was created in 1872 from what I can find and it shows us 270 years worth of booms and busts within the global economy. Simply titled, "Periods When to Make Money"
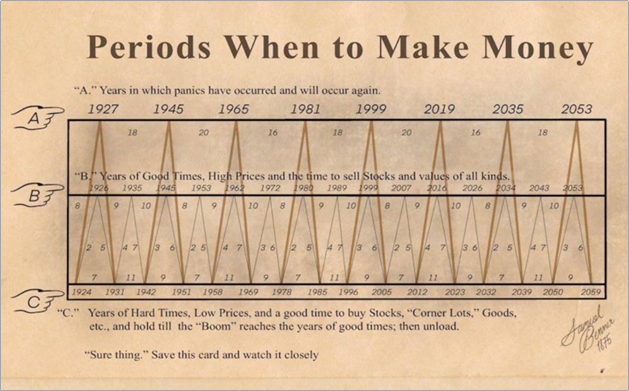
So first off, we know for sure this is old-timey because of the wording used. The 3 pointing fingers state
A- Years in which panics have occurred and will occur again
B- Years of good times, high prices and the time to sell stocks and values of all kinds
C- Years of hard times, low prices and a good time to buy stocks, "corner lots" goods etc and hold till the BOOM reaches the years of good time then unload.
There is alot of information here in this chart and after doing some Googling, it's pretty spot on. If you'd DCA'd into the DOW index during a C year and DCA'd out during a B year, you'd pretty much always make money until the 1980s when things derailed a little. Massive unforeseeable inflation is the reason. mostly. Damn you inflation!
(Pasted chart again to save you from scrolling up)
The chart shows the overall market follows a 54-year cycle broken into x2 27-year cycles with 3 boom and bust inner cycles within those 27. Each inner takes 1 year longer than the last. The booms start at 8 years, then 9 years and 10 years apart and then it resets and repeats that pattern of 8,9,10 years every 27 years. The busts are, 7 years, 11 years and then 9 years apart.
The top line A is for world events, like recessions, blawn swans and the like and these run within the 54-year cycle showing world events happen every 18 years, 20 years and 16 years apart.

It's a pretty impressive chart because it was created almost 150 years ago and it was pretty bang on till the 80s when proper inflation was kicking in from USD being depegged from gold about 2 decades before. Things on a global scale take time. I saw somewhere that when the government mints $1 trillion today, it takes 6-8 years before that money trickles down and hits the bottom and has an impact on the economy (inflation).
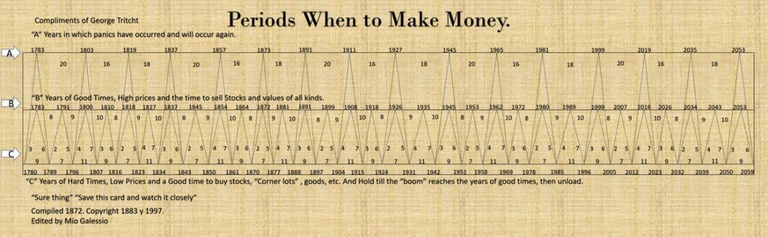
Here's the full chart. It's too wide and hard to read to make a good thumbnail. It started in 1780
What do you think about that?
The creator could never have factored in money printing from thin air we have today, they lived in a time of deflation and GBP was the world's reserve currency.
Oh yes, im about to blow your mind. Between 1815 and 1914, most countries had no inflation and prices just stayed the same all the time. In many cases, things in 1914 were cheaper than in 1815 because productivity had increased in 100 years and this reduced the cost. Yeah, the world used to work like.
Oddly enough the Federal Reserve (Private Company) Was Created on the 23rd of December 1913. Bankers had tried to create FEDs a few times in the 1800s but people blocked them because people, the general public understood what money was back then. The bankers got the FED approved 2 days before Christmas because everyone else went home early to start spending time with their families.

It is the single greatest scam in history where a few now owned the money supply which in turn gave them total power and control everything cause money makes the money go round.
Pre-Fed, A parent could have bought a house for $1000 in the 1820's and a great-grandchild could have sold it for $1000 in the 1900's. Your pay never increased and when it did, a pay rise was a pay rise and could increased your quality of life. Payrises now dont even keep up with inflation today. This concept of prices not going up and no inflation is unthinkable for most NPC's today and takes a few minutes to get your head around.
So what do you think of the chart? Could we get back onto its course again, could something to get a ballpark idea or is it outdated and complete crap? Let me know in the comments below.
| Token Name | Main Account | Link to hive-engine |
|---|---|---|
| SPI token | @spinvest | SPI |
| LBI token | @lbi-token | LBI |
| Top XV token | @spinvest | XV |
| Eddie Earners | @eddie-earner | EDS |
| EDS miners | @eddie-earner | EDSM |
| EDS mini miners | @eddie-earner | EDSMM |
| DAB | @dailydab | DAB |
| DBOND | @dailydab | DBOND |
Stay up to date with investments, and fund stats and find out more about SPinvest in our discord server

Inflation sure put a hurting on my stacking, I'm glad we started years ago. I'm starting to get worried about my holdings in the brokerage accounts as to who will get them in a reset. I don't think charts matter anymore, I wish they did!
!pimp
You must be killin' it out here!
@tbnfl4sun just slapped you with 5.000 PIMP, @spinvest.
You earned 5.000 PIMP for the strong hand.
They're getting a workout and slapped 2/2 possible people today.
Read about some PIMP Shit or Look for the PIMP District
Pretty cool chart!