Gravestone Doji in a Downtrend
A Gravestone Doji is usually taken by technical analysts as a bearish indicator. It commonly appears in an uptrend and a signal of buyers' exhaustion and the return of sellers to the market. When you see this indicator, it signals a reversal in the current trend. This is how I understand this indicator as it is used in the stock market.
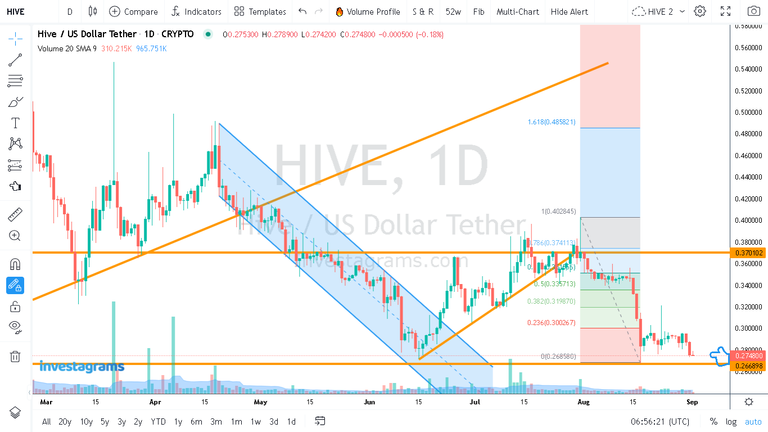
After reading the thread of onealfa.leo about this indicator, I got curious and checked $HIVE and I saw this Gravestone Doji as the last candlestick.
Except for the question about the legitimate use of traditional technical indicators in the crypto space, the appearance of this candlestick is anomalous.
In the first place, we see the appearance of Gravestone Doji not after a bullish run, but after a market sell-off. How shall we then interpret the appearance of this indicator in a downtrend? Many analysts would not rely on this single indicator for their trading and would check instead the history of the price and trading volumes.
Instead of buyers' exhaustion, I see the sudden appearance of this candlestick as sellers' exhaustion. Such an observation is confirmed by low volume. Remember also that two big red candles preceded this gravestone candlestick.
Considering the price history beginning July 31, what we see here is a failure to push the price of $HIVE above $0.40 and it was then followed by a price drop, consolidation, three red crows, another consolidation, two red candlesticks, and finally, a gravestone doji. For me, this completes the basic formation of a larger wave, three motive waves, and two corrective waves.
If we take Gravestone Doji as traditional analysts interpret it, which is a 'bearish reversal trend indicator," then we will have a problem applying it to $HIVE for it appears not at the top of an uptrend but at the bottom of a downtrend. Yes, there is resistance from sellers, but again such resistance is insignificant for it is not supported by bigger volume.
I would be happy to see that perhaps a day or two from now we will instead have a Dragonfly Doji, which is a bullish reversal trend indicator.
https://leofinance.io/threads/rzc24-nftbbg/re-rzc24-nftbbg-pusqomjl
The rewards earned on this comment will go directly to the people ( rzc24-nftbbg ) sharing the post on LeoThreads,LikeTu,dBuzz.
I was not familiar with those indicator patterns so its nice to learn about them.
Some say September will be a down month as it always has been for Bitcoin. HIVE seems to track BTC very closely. I'm plodding along toward my 50K HP Orca goal and will consider a HIVE buy at 25 cents or less.
Hoping for bullish indicators followed by bullish price action in the 4th Quarter of this year and maybe into Q1 of 24. Wishing good luck for us all!
Yeah, and there are times that $HIVE even anticipates what's coming. Congrats in advance on achieving your Orca goal. Blessings!
!PIZZA
!BBH
@kenny-crane! Your Content Is Awesome so I just sent 1 $BBH (Bitcoin Backed Hive) to your account on behalf of @rzc24-nftbbg. (1/5)
Congratulations @rzc24-nftbbg! You received a personal badge!
Participate in the next Power Up Day and try to power-up more HIVE to get a bigger Power-Bee.
May the Hive Power be with you!
You can view your badges on your board and compare yourself to others in the Ranking
Check out our last posts:
$PIZZA slices delivered:
@rzc24-nftbbg(1/5) tipped @kenny-crane