$HIVE’s 20 and 50-Day MAs
When I was in the stock market, I used to create technical charts. Among my favorite tools include Fibonacci Retracement, Elliot Wave Theory (EWT), Mark Minervini’s Volatility Contraction Pattern (VCP), and the use of Moving Averages (MAs).
Overview of Moving Averages
Moving averages are basic tools in technical analysis and are widely used by traders and analysts to interpret price trends and potential entry or exit points in the financial markets. However, these indicators are commonly used in the stock market. I am not sure how reliable they are when it comes to the crypto space. Nevertheless, though some would question its validity when applied to cryptocurrency, still many are utilizing these tools in interpreting market trends.
Except for trend identification, other use cases for moving averages include finding the support and resistance levels, crossovers, chart pattern confirmation, and reversal signals.
Moving averages, though recognized as useful tools in technical analysis, most analysts don’t rely on them exclusively. Instead, they use MAs in conjunction with other indicators like accumulation/distribution, price exhaustion indicator, momentum, and net volume.
A short-term indicator that is responsive to changes in price is the 20-day moving average.
In contrast, the 50-day and 100-day moving averages offer an intermediate-term perspective of the price trend and are less susceptible to transient changes.
Investors and traders frequently use the 200-day moving average, which is the only tool that provides a long-term picture of the price trend, to determine the general trend direction of the price of a specific asset class they are keeping an eye on.
Both 20-day and 50-day MAs crossing the 200-day MA
If the current price action of $HIVE will continue, in the coming days we will see the crossing of the 50-day MA over the 200-day MA. Just this morning, I observed that the 20-day MA of $HIVE already crossed both the 100-day and the 200-day MAs of $HIVE last 28 October and 04 November respectively. This means that this short-term indicator has already jumped over both the medium and the long-term price trend of $HIVE.
Though the 20-day MA is significant in identifying the short-term trend, the crossing of the medium-term price indicator such as the 50-day MA over the 200-day MA will confirm the continuity of the current trend. As far as the mid-term view is concerned, what we see in the chart below, a 50-day MA crossing over the 100-day MA last 03 November is a bullish signal.
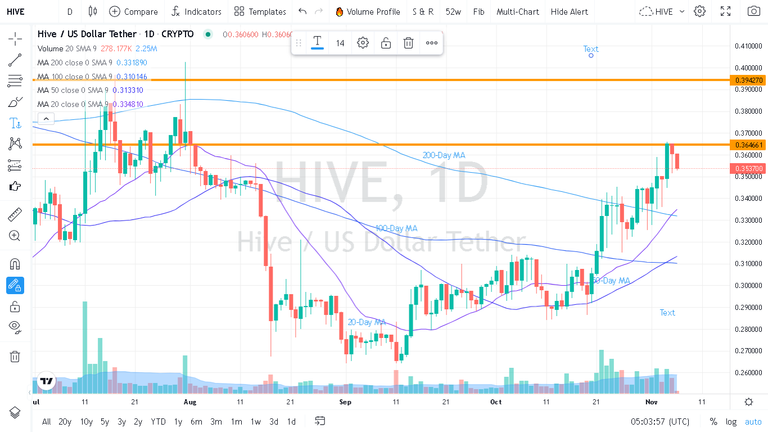
In short, when the 20-day and 50-day MAs cross above both the 100-day and 200-day MAs, it suggests that the recent price trend is strong enough to overcome the longer-term trends. This crossover is often interpreted as a bullish signal, indicating that the asset's price might continue to rise soon. Traders often use this crossover as an entry signal to buy the asset, expecting further price appreciation.
One final note, as mentioned above, one use case for MAs includes finding the support and resistance levels. The above chart shows that breaking out the resistance level near the $0.37 area will provide another layer of confirmation to the shift in market trend.
In closing, it's important to emphasize that no single indicator or signal guarantees success in the crypto space. Traders and investors use multiple tools and indicators in conjunction with fundamental analysis to make well-informed decisions about buying or selling. Additionally, market conditions can change rapidly, so it's crucial to stay updated and exercise caution when making trading decisions.
This post has been manually curated by @bhattg from Indiaunited community. Join us on our Discord Server.
Do you know that you can earn a passive income by delegating to @indiaunited. We share more than 100 % of the curation rewards with the delegators in the form of IUC tokens. HP delegators and IUC token holders also get upto 20% additional vote weight.
Here are some handy links for delegations: 100HP, 250HP, 500HP, 1000HP.
100% of the rewards from this comment goes to the curator for their manual curation efforts. Please encourage the curator @bhattg by upvoting this comment and support the community by voting the posts made by @indiaunited.