Doji and HIVE's Moving Averages
It has been more than a month since I published a technical analysis of HIVE. At that time, I thought HIVE would break the 0.54 resistance and challenge 0.99. I still stick with my parabolic interpretation though I don't know when will it happen exactly.
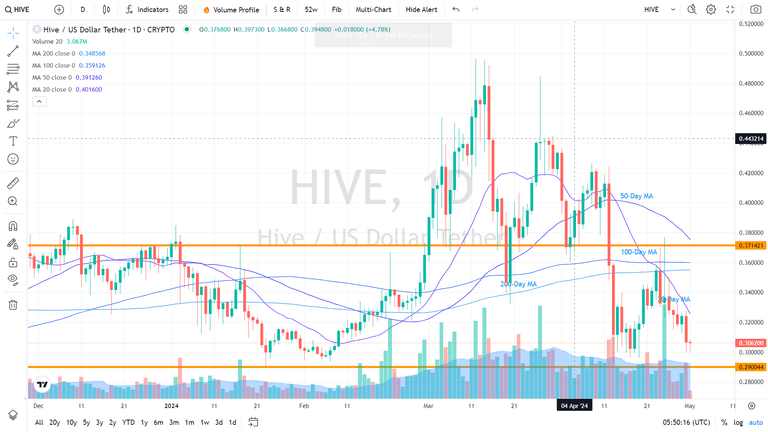
Looking at the current chart of HIVE, I am glad to see a doji after a prolonged price decline. This could indicate indecision. Neither the buyers nor the sellers were able to gain control leading to a standoff.
In the context of a downtrend, a doji could signify that selling pressure may be weakening. However, it is still premature to interpret this as a trend reversal pattern. At best, it could be seen as a temporary pause. Perhaps, sellers are tired. Short-term traders typically look for additional indicators to confirm a change in trend direction.
At least for the short-term, that's what I see in observing both doji and the two shorter moving averages of HIVE, the 20 and 50 MAs. The good thing is as far as the long-term trend is concerned, both the 100 and the 200 moving averages tell us that the long-term trend of HIVE remains bullish. The most appropriate response in having a rare opportunity like this is to increase one's position while HIVE is still on sale.
Congratulations @rzc24-nftbbg! You received a personal badge!
Wait until the end of Power Up Day to find out the size of your Power-Bee.
May the Hive Power be with you!
You can view your badges on your board and compare yourself to others in the Ranking
Check out our last posts:
Congratulations @rzc24-nftbbg! You received a personal badge!
Participate in the next Power Up Day and try to power-up more HIVE to get a bigger Power-Bee.
May the Hive Power be with you!
You can view your badges on your board and compare yourself to others in the Ranking
Check out our last posts: