Early Signs Of A Recovery?

There has been weakness in the crypto market since July. Like many crypto enthusiasts, I look at prices 4-5 times daily and mostly see red percentage changes. 1-hour percentage change best shows the direction of the market. When prices are weak, hourly data often indicates a decline. We can even understand the market by looking at the number of greens and reds in the table below.
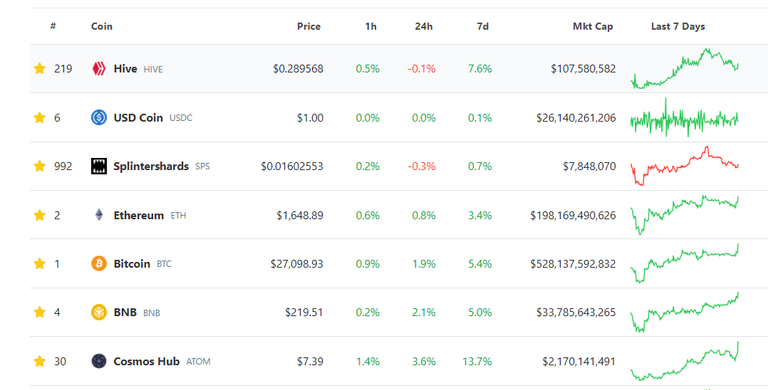
For the last few days, 1-hour data has been mostly positive. This situation motivated me to check technical indicators. Do the technical indicators support the idea that things are starting to improve? Examining the crypto market, focusing on Bitcoin and altcoins separately, can help us understand the trend better.
Bitcoin
Weekly RSI values above 50 indicate an upward trend. The RSI chart below, created on the weekly Bitcoin chart, shows that the 50 level is being passed.
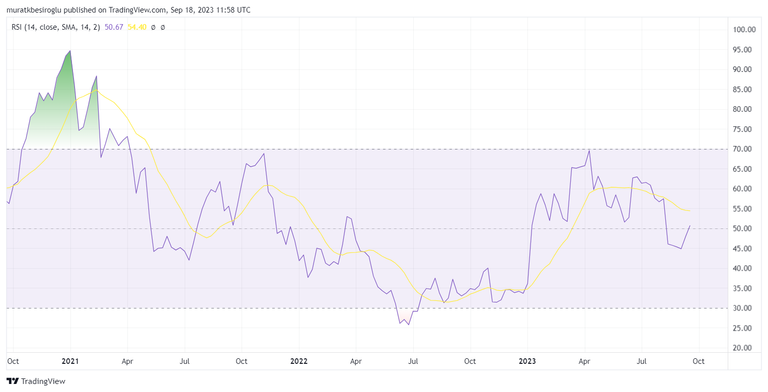
In the same chart, we see that during the Bitcoin rally that started in January, the RSI exceeded the 50 level. On the other hand, the "false breakout" that occurred in April 2022 is also seen in the chart. Therefore, it is better to be cautious.
On Bitcoin's daily chart, the RSI is above 50. MACD indicates a buy direction. The price is above the 200-day exponential moving average. The 200-day simple average has yet to be crossed.
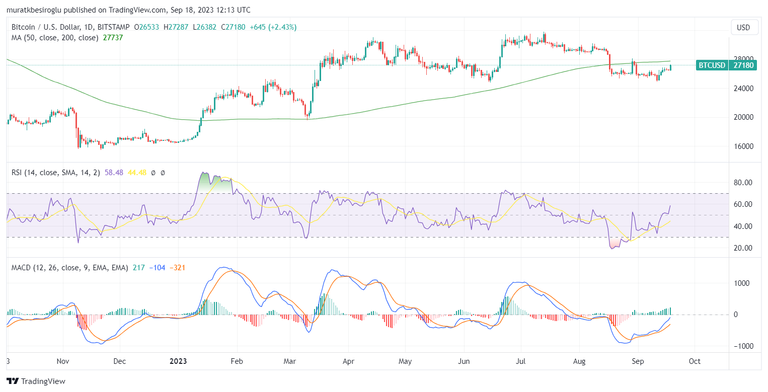
The indicators I mentioned above show that the possibility of an uptrend is getting stronger.
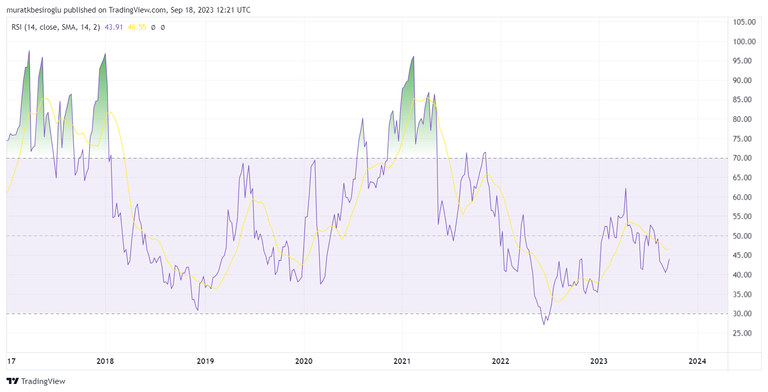
Crypto Total Market Cap Bitcoin Excluded
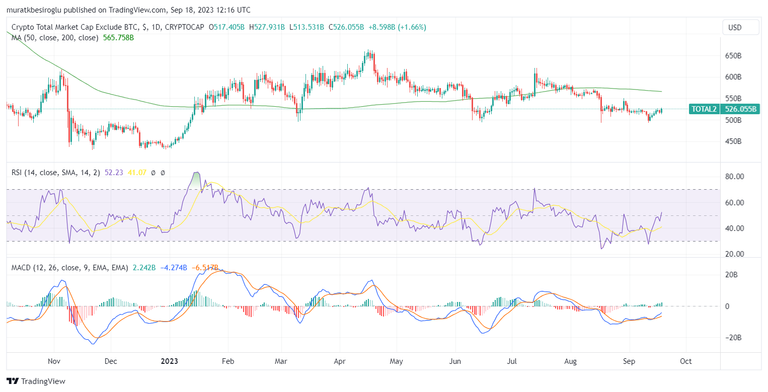
The weekly chart shows that the RSI for the total value of altcoins is below 50. Therefore, we cannot talk about a medium-term upward trend for altcoins.
On the daily chart, the RSI is above 50. Although the outlook on MACD is positive, we are below the 0 level. We also see that the total value of altcoins is below the 200-day average.
TL;DR
Analyst Plan-B, the creator of the stock-to-flow model, pointed out around October for the Bitcoin rally. Because in previous cycles, the upward trend in Bitcoin started six months before the halving.
Is there enough liquidity to support a possible Bitcoin rally? Liquidity was also shrinking during the rally in January. It means that Bitcoin can also rally during monetary tightening.
The 200-day average at 27,700 must be crossed permanently to discuss an upward trend. As of now, the Bitcoin price is 400 points behind this level.
Last month, the rapid decline in inflation slowed down, and rigidity occurred due to the impact of oil prices. In the meantime, public bond interest rates also rose. There is a 98% chance that the FED will leave interest rates steady this week. On the other hand, the probability of a 25 basis point increase at the November meeting is at 31%. It may take some more time for the situation to become clear on the macroeconomic front. The end of interest rate increases will increase interest in crypto. However, we will have to wait a few more months for this to happen.
For altcoins, the situation is more complicated. We have yet to discuss an upward trend or signs of an upward trend. If Bitcoin rises with solid momentum, altcoins may follow it.
It's been 3-4 hours since I started writing this article. Hourly percentage changes were solid green during this period. This situation shows a constant inflow of funds. We should continue to see greens on the charts for a while longer. (We missed seeing greens) :)
Thank you for reading.
Cover Image Source: Midjourney App
!pizza
!hug
!meme
@tin.aung.soe, sorry!
You are out of hugs for today.
You can call the HUG bot a maximum of 3 per day.
The current call limits are:
Credit: gymnasticsqueen
Earn Crypto for your Memes @ HiveMe.me!
Thank you for this informative data-filled article about the key factors to monitor to identify the coming green waves on the market.
Early can be in a few hours or many months.
Anything can happen, please be cautious with your assets movement.
Great stats. I do miss seeing greens, but, if you ask me if I sincerely want a bull run, my answer will be no, because I am not ready.
Thank you for the round up of the technical analysis. You are doing well, sir 🔥🔥