Ya paso el “Halving” de Bitcoin ¿Que debemos esperar en el mercado crypto? [ES-EN]
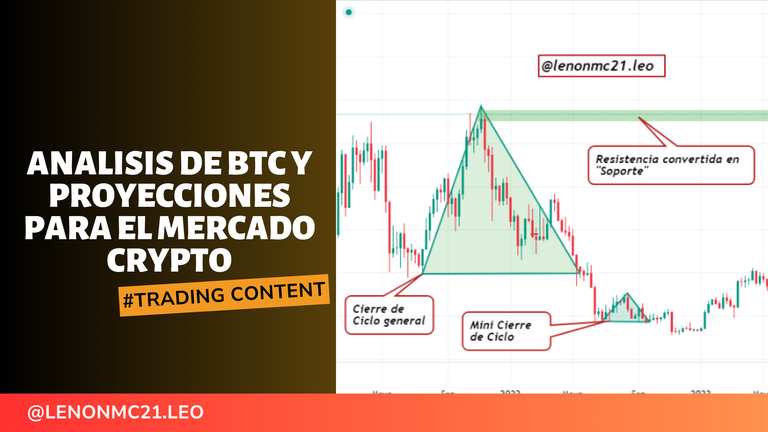
El “Halving” de bitcoin ya ha pasado y las recompensas que obtienen los mineros ha pasado de 6.25 BTC a 3.125 BTC, lo que representa en moneda menos recompensa, sin embargo, mientras esto pasa, la realidad es que BTC se hace mucho más escaso, lo que causa que se vuelva aún más valioso, por lo que, lo que podemos esperar es un aumento de precio sin presentes, al menos es lo que la historia nos ha enseñado y ha corroborado cada vez que el “Halving” se celebra cada 4 años.
Sabiendo esto, imagino que muchos se estarán preguntando qué pasará con el mercado de criptomonedas ¿Seguirá la tendencia alcista o al contrario vendrá una corrección más fuerte del precio? Esto es lo que precisamente explicare analizando el grafico de BTC y adicional observando información referente a lo que siempre ha sucedido cada vez que se ha celebrado el “Halving”, así que, si tienen inversiones en cryptos, les conviene leer este post hasta el final, ya que analizare a detalle el BTC.
! [Version en Ingles]
[EN]
The bitcoin Halving has already passed and the rewards miners get has gone from 6.25 BTC to 3.125 BTC, which represents in currency less reward, however, while this happens, the reality is that BTC becomes much scarcer, which causes it to become even more valuable, so, what we can expect is an unpresent price increase, at least that is what history has taught us and has corroborated every time the Halving is celebrated every 4 years.
Knowing this, I imagine that many are wondering what will happen to the cryptocurrency market, will the uptrend continue or on the contrary, will there be a stronger price correction? This is precisely what I will explain by analyzing the BTC chart and additionally observing information regarding what has always happened every time the "Halving" has taken place, so, if you have investments in cryptos, you should read this post until the end, since I will analyze the BTC in detail.
Análisis de “Acción del Precio” de Bitcoin

Como es primera vez que les traigo un análisis, explicare brevemente que es lo que traeré en esta sección, así que presten mucha atención:
- Análisis de BTC en grafico semanal
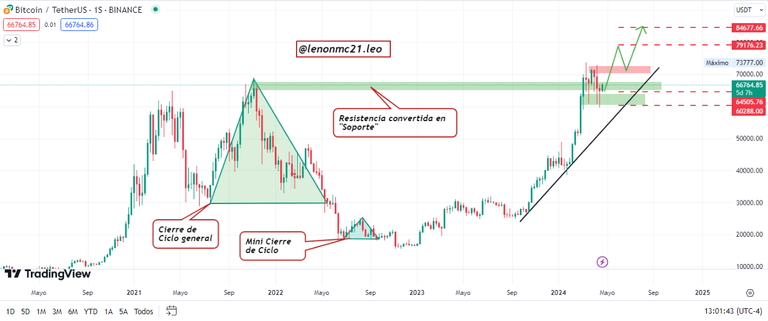
Si quieren comenzar en la carrera de los mercados financieros, mi recomendación siempre será que se enfoquen en temporalidades altas, ya que la acción del precio y el grafico en sí mismo tiene mucho menos ruido y es más fácil de analizar, si observan bien la imagen anterior, se formó lo que llamo un “Cierre de Ciclo General” que no es más que un cierre de transacciones, o lo que llaman por allá fuera como “Imbalance”, algo muy parecido.
Posteriormente se formó un “Mini cierre de ciclo”, confirmando básicamente lo que sería el cambio de la "Estructura" que venía haciendo el precio, la cual, en este punto paso de bajista a alcista, para luego romper zonas recientemente creadas conformando la fuerza alcista y haciendo “Tendencia”. Luego el precio rompió lo que era la última “Resistencia” que había dejado el precio entre los $68.000 y $69000, confirmando aún más la fuerza alcista. Por último, están los próximos niveles de precio pintados con líneas rojas punteadas, lo más seguro con altas probabilidades es que el precio llegue a esos niveles entre “julio y agosto” de este mismo año.
- Análisis de BTC en grafico diario
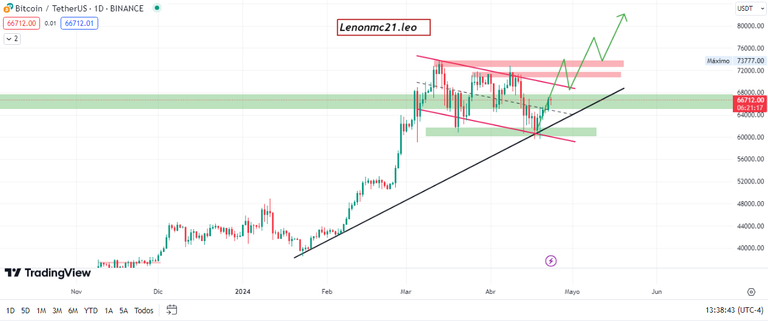
En el grafico diario del BTC, la acción del precio se muestra un poco más detallada debido a que es un gráfico menor que el anterior, por lo que podemos ver más velas y aunque se muestra más ruido, la acción del precio es igual de confiable ya que esta temporalidad también es realmente alta, así que, tomando esto en cuenta, lo único que he hecho es trazar un canal bajista bien marcado que está realizando el precio en conjunto con una línea de tendencia que el precio ha venido respetando perfectamente, confirmando que la “Estructura del precio” sigue siendo alcista a pesar de estar en un canal bajista.
En este sentido lo que podemos esperar es que el precio haga una ruptura de los puntos que he marcado como “Resistencia” así como el mismo canal marcado para que el precio sigue su curso, recordemos que, este es solo un “Retroceso”, los cuales, también son formados con “Estructura”, por lo que, la forma correcta de tomar una entrada es esperar a que el precio rompa la estructura bajista de ese canal, confirma la estructura alcista y esperar el retroceso para tomar la entrada, lo más sencillo de esto es que hay que tener en cuenta que, los soportes son para comprar y las resistencias para vender.
! [Version en Ingles]
[EN]
As this is the first time I bring you an analysis, I will briefly explain what I will bring in this section, so pay close attention:
- BTC weekly chart analysis
Source
If you want to start in the financial markets career, my recommendation will always be to focus on higher time frames, as the price action and the chart itself has much less noise and is easier to analyze, if you look closely at the image above, it formed what I call a "General Cycle Close" which is nothing more than a close of transactions, or what they call out there as "Imbalance", something very similar.
Subsequently, a "Mini cycle closing" was formed, basically confirming what would be the change of the "Structure" that the price had been doing, which, at this point went from bearish to bullish, to then break recently created zones forming the bullish force and making "Trend". Then the price broke what was the last "Resistance" that had left the price between $68,000 and $69,000, further confirming the bullish strength. Finally, there are the next price levels painted with dotted red lines, most likely with high probabilities that the price will reach those levels between "July and August" of this year.
- BTC daily chart analysis
Source
In the BTC daily chart, the price action is shown a bit more detailed because it is a smaller chart than the previous one, so we can see more candles and although more noise is shown, the price action is just as reliable since this temporality is also really high, so, taking this into account, the only thing I have done is to plot a well marked bearish channel that the price is making in conjunction with a trend line that the price has been respecting perfectly, confirming that the "Price Structure" is still bullish despite being in a bearish channel.
In this sense what we can expect is that the price makes a breakout of the points that I have marked as "Resistance" as well as the same channel marked for the price to follow its course, remember that, this is only a "Retracement", which, are also formed with "Structure", so, the correct way to take an entry is to wait for the price to break the bearish structure of that channel, confirm the bullish structure and wait for the retracement to take the entry, the simplest thing about this is that you have to keep in mind that, supports are to buy and resistances are to sell.
¿Hasta dónde puede llegar este “ciclo alcista”?
La historia nos ha enseñado que luego de que se lleva a cabo el “Halving” de Bitcoin, el precio explota para ir en busca de nuevos máximos hasta que se produzca un nuevo retroceso que convierta el ciclo en bajista, sin embargo, muchos se estarán preguntando hasta donde llegara, saber esto quizás los pueda preparar para no comprar en máximos y aguantar un retroceso del precio que dure aproximadamente de 2 años a 3 años, así que, investigando un poco en “Twitter”, conseguí una excelente grafica que muestra el ciclo, hasta donde podría llegar y las fechas aproximadas de esto, veamos la siguiente imagen:
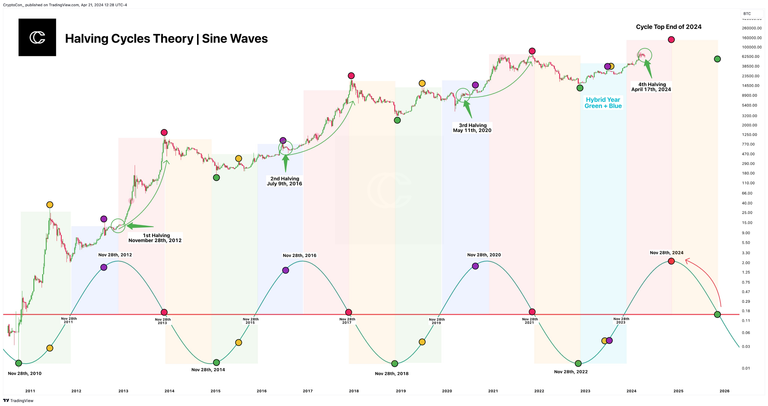
En la imagen anterior podemos ver que el precio objetivo aproximado de este ciclo, si situaría en los $150.000, según esta información, el ciclo podría llegar a su fin entre noviembre y diciembre de este mismo año, aunque, personalmente pienso que lo veremos extenderse hasta el siguiente año 2025 dentro del primer trimestre, pero, con esto al menos pueden saber el tiempo, por lo que, aun estamos a tiempo de comprar BTC a estos precios.
! [Version en Ingles]
[EN]
History has taught us that after the Bitcoin "Halving" takes place, the price explodes to go in search of new highs until there is a new retracement that turns the cycle bearish, however, many will be wondering how far it will go, Knowing this perhaps can prepare you not to buy at highs and endure a price retracement that lasts approximately 2 years to 3 years, so, doing some research on "Twitter", I got an excellent graph that shows the cycle, how far it could go and the approximate dates of this, let's see the following image:
Source
In the image above we can see that the approximate target price of this cycle, if it would be at $150,000, according to this information, the cycle could come to an end between November and December of this year, although, personally I think we will see it extend until the following year 2025 in the first quarter, but, with this at least you can know the time, so, we are still in time to buy BTC at these prices.
Consideraciones Finales
Estamos en el mejor momento del mercado, aunque no lo parezca, es una oportunidad única para adquirir “Bitcoin” barato, estoy seguro de que tocaremos los niveles de los $100.000 muy pronto, sin mencionar que el resto de las criptomonedas o tokens con proyectos solidos también se verán afectados de manera positiva con la subida inminente del BTC. Espero que esta información les haya aportado algo de valor, por lo pronto me despido y nos vemos en el siguiente post.
! [Version en Ingles]
[EN]
We are in the best moment of the market, although it may not seem like it, it is a unique opportunity to acquire "Bitcoin" cheap, I am sure that we will touch the $100,000 levels very soon, not to mention that the rest of the cryptocurrencies or tokens with solid projects will also be affected in a positive way with the imminent rise of the BTC. I hope this information has provided you with something of value, for now I say goodbye and see you in the next post.

Congratulations @lenonmc21.leo! You have completed the following achievement on the Hive blockchain And have been rewarded with New badge(s)
Your next target is to reach 300 upvotes.
You can view your badges on your board and compare yourself to others in the Ranking
If you no longer want to receive notifications, reply to this comment with the word
STOPCongratulations on a job well done! We are thrilled to see the outstanding results you've achieved. Your dedication and hard work have truly paid off, and it's inspiring to witness the impact you've made. Keep up the fantastic work, and know that your contributions are valued and appreciated.