Understanding Crypto trading tools - Price charts
Even as a beginner or advanced crypto trader, you need to master the tools that will streamline your trading experience and minimize losses. Data management in crypto trading is as important as anything. When you learn the tools used to analyze trading data and make the right decisions, then you will likely do well in your journey as a crypto trader.
There are many tools that crypto traders use. Some of the tools are a must, while others are a matter of choice. Because there are many tools to look at, this article will have many parts, beginning from this one which is the first part.
In this part, I will look at the following crypto trading tool:
- Price chart
Please note that I will be using Binance exchange platform to provide the illustrations needed to have a comprehensive understanding of the tools mentioned above. Now lets begin with the first item.
Price chart
The price of cryptocurrencies are usually very unstable. It changes over time because of crypto's volatile nature. That is why crypto traders make use of price charts to help them track the price movement of any crypto over time. When traders study price charts very well, it helps them make the right decisions such as when to sell, buy or hold a particular crypto.
Each crypto exchange or trading platform provides their own price charts for all the listed cryptocurrencies. The design, content and features of each price charts vary from platform to platform but some features are always consistent.
There are many forms of price charts and each display price data in a peculiar way. Below are the two most popular price charts you will likely see in every crypto platform:
- Line Charts: Line charts are perhaps the simplest of all charts. Just as the name implies, lines are use to mark vital stages of the price movement over time. A line chart can contain just one line used to track a particular aspect of the price such as the closing price of the crypto. There could also be multiple lines in a line chart, each indicating an aspect of the price history. Below is a sample line chart
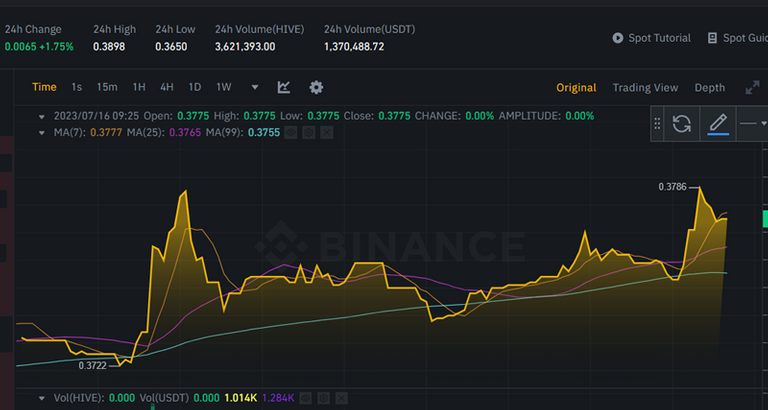 Hive/USDT line chart from Binance
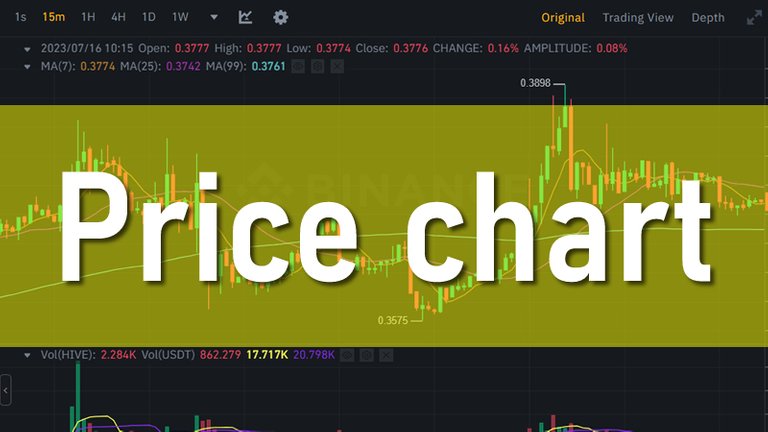
- Candle stick charts: Candle sticks are so popular you see them on every trading platform. The shape of each candlestick is a rectangular bar. They are formed depending on the price movement of the crypto pairs they represent. Candlesticks can indicate different stages of price movement such as when the price is high or low. Once you master how to read candlesticks, your crypto trading journey has just began. Take a look at the candle stick below:
 Hive/USDT Candlestick chart from Binance
Tools/ Features of price charts - Binance
The price chart window of each crypto pair comes loaded with many features and tools that traders find helpful. Let us take a look at some of these features for the HIVE/USDT pair.
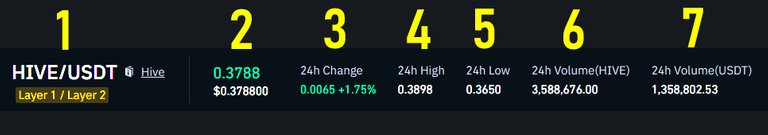
1. Name of pair/ blockchain type As you can see above, the name of the crypto pair is HIVE/USDT. Under that, you will see the type of blockchain Hive is - Layer 1/Layer 2. Here is what Binance explained about that the blockchain type.
Listed below are top Layer-1 and Layer-2 crypto tokens. Layer-1 crypto projects refer to primary blockchain networks that house decentralized applications. Layer-2 crypto projects refer to scaling solutions that run on top of an existing primary network.source
The above information is vital as it helps the trader know the type of blockchain that powers the crypto. Its clear from their explanation that Hive is hosted on a blockchain that powers DAPPS. There are other types of tokens such as those from MetaVerse, Meme, Defi, gaming, etc
2. Token current Price: The next data displayed above is the current price of Hive the token in USD. When this screenshot was made, Hive was priced at $0.3788.
3. Change over 24 hours: The third data shows how the coin has changed in price in the last 24hours. As you can notice, HIVE made +1.75% gain. That represents an addition of 0,0065 HIVE added to the price since 24 hours. This gives traders a good idea of whether the coin is going up or down.
4. Highest price in 24 hours: The next data shows the highest price attained by HIVE the coin in the last 24 hours. As shown above, HIVE had its price peak at $0.3898. A trader uses this information to know how the coin is performing at the moment.
5. Lowest price in 24 hours: This data shows the lowest price attained by HIVE the coin in the last 24 hours. As shown above, HIVE had its lowest price at $0.3650. This data gives insight into how far the coin has declined compared to its current price.
6. Trading volume in 24 hours: This next data shows how much HIVE has been bought or sold in the last 24 hours. As you can see above, a total of 3,588,676 HIVE has been traded within the last 24 hours. The trading volume helps traders understand a lot about the coin such as to know whether the coin has sufficient liquidity.
7. Pair trading volume in 24 hours: Remember that this is a price chart for HIVE/USDT pair. So the next and last figure indicates the trading volume of USDT in the last 24 hours. As at the time of writing, it stands at 1,358,802.53
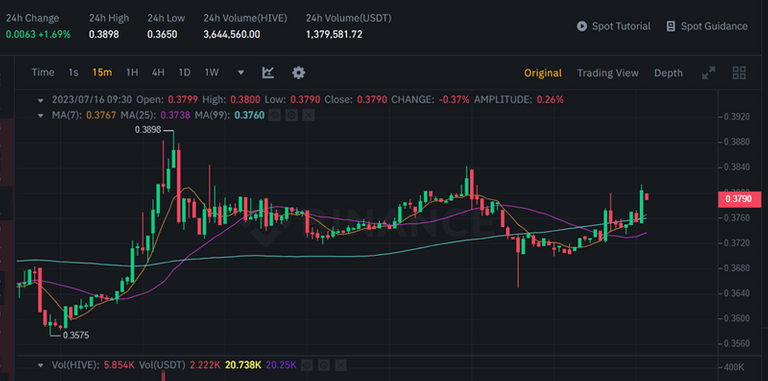
There are many other features that you see in a price chart. Just as we are using Binance, it comes with much more. Take a look at this below:
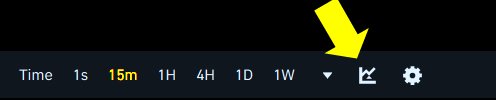
This is part of the HIVE/USDT price chart. This bar helps the trader see the price movement based on time. The trader could decide to see the price movement in the last 15 minutes, 4 hours, 1 week and so on. This is important for a deeper technical analysis.
The yellow arrow is pointing at the technical indicator icon. technical indicators help a trader make calculations based on price movement. It then gives traders a hint of what action to do either to buy, sell or hold. There are many different types of technical indicators. One of them is Moving Average (MA). So when you click the icon above, it takes you to the box below.
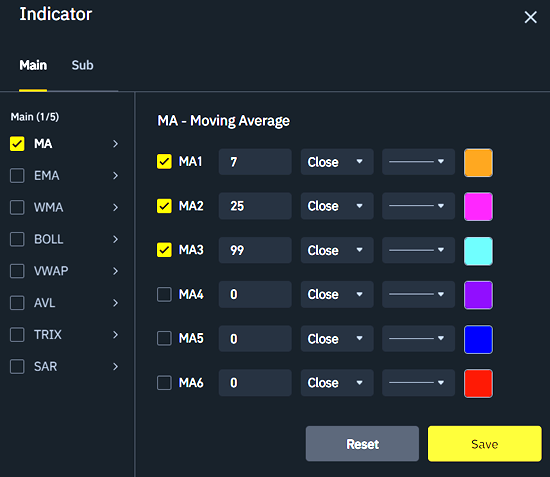
You can see above that Moving Average is the default technical indicator. But one can choose to add the other ones and make settings. This will help the trader to study the market in-depth and be able to make decisions.
Conclusion
Price charts are very important for every crypto trader. The price charts help traders to see the current price of pair. It helps to see the past price movement and the tools in price charts help to do a technical study in order to understand the price movement of a crypto pair better.
Posted Using LeoFinance Alpha
This is quite educative no matter how long you have been as a trader you will need to understand the important part of trading which includes the price chart where you get to understand the line chart and the candlestick.
I think I should reblog this for future reference
This is true. Mastering the price chart is one of the earliest steps to take as a crypto trader. The candlestick chart is a must-know for every trader. They can then advance and learn about technical indicators.
whether we are old or new in crypto I strongly believe that we still have a lot of things to learn,one can never say I know it all room for new understanding is still open
For us all . thanks for this post @focusnow
Crypto trading is always technical, but when you master the fundamental tools and tactics, you will go far. Price chart us one of the tools that everyone needs to know and master.
This is a very nice piece . Mastering your price chart will go a long way in helping any crypto trader to study the market fully and be able to make decisions on time.
That is for sure. The price charts are not too difficult to master. So you can start your learning crypto trading from here.
Mhnnn my brother, mastering the tools of trading is more than important because, without that, it's losses you will be recording. Knowing the Charts, Candle sticks and their movements etc. etc. should never be overlooked.
Learning is where all new crypto traders have to start from. Then, they can understand how the market works and master the tools. Price chart is really a great place to start.
Learning and studying it seriously because practice makes perfect, @fokusnow thanks.
Congratulations @fokusnow! You have completed the following achievement on the Hive blockchain And have been rewarded with New badge(s)
You can view your badges on your board and compare yourself to others in the Ranking
If you no longer want to receive notifications, reply to this comment with the word
STOPCheck out our last posts: