Comparing bar charts and pie charts using a data set
In the last few posts, I have introduced two statistical data presentation elements - bar charts and pie charts. Each of them have a unique way of displaying statistical data so that you can compare the different components presented. But we can always compare them and see which is best for presentation data. You can free to make your choice after seeing the two used together in presenting the same data. Which is easier or more comprehensive - pie charts or bar charts? You can answer after seeing the example below.
Example 1: The following is the number of students grouped by their state in a Computer Science department of a university in Nigeria. Abia 410, Enugu 45, Imo 105, Kano 155, Lagos 125.
(a). Represent the information in a pie chart
(b). Represent the information in a bar chart
(c) If a student is selected at random, what is the probability that he is from Abia state?
Solution
Lets start with the first question:
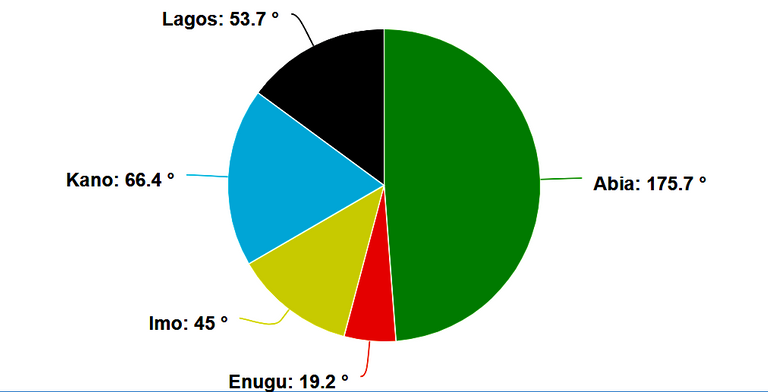
(a). Represent the information in a pie chart
I will prepare a table and work out the size of each student group in the sector.
Table of Student states and sectors
| Student state | number | angle of sector (degrees) |
|---|---|---|
| Abia | 410 | (410/840)x360 = 175.7o |
| Enugu | 45 | (45/840)x360 = 19.2o |
| Imo | 105 | (105/840)x360 = 45.0o |
| Kano | 155 | (155/840)x360 = 66.4o |
| Lagos | 125 | (125/840)x360 = 53.7o |
| Total | 840 | 360o |
Now we can draw the Pie chart
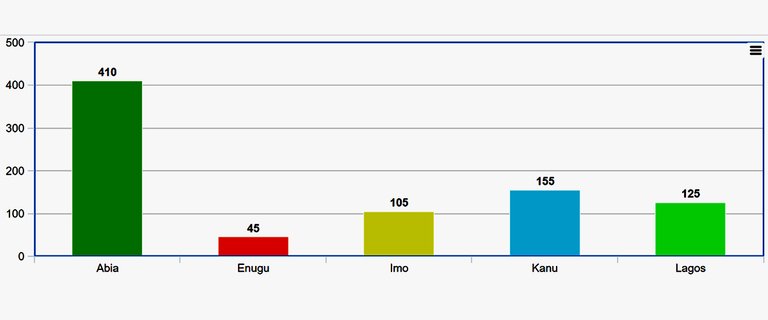
(b). Represent the information in a bar chart
I will need to make a table for the bar chart. Let me remove the sector column from the table above. We will have :
Table of Student states and numbers
| Student state | number |
|---|---|
| Abia | 410 |
| Enugu | 45 |
| Imo | 105 |
| Kano | 155 |
| Lagos | 125 |
| Total | 840 |
Having made the table, you can see the bar chart below:
Conclusion
You can see the two data formats above used to represent the data. So which do you think is easier to do. Or which do you think makes the data more comprehensive? Use the comment section to share your thoughts with me. Thank you so mcu.
Thanks for your contribution to the STEMsocial community. Feel free to join us on discord to get to know the rest of us!
Please consider delegating to the @stemsocial account (85% of the curation rewards are returned).
Thanks for including @stemsocial as a beneficiary, which gives you stronger support.
Perfect!