There is Great Resistance on Logarithmic Hive Price Chart
Even Hive price broke up great resistance on linear chart, There is still great resistance on Logaritmic Hive price chart.
I shared lots of analysis on linear Hive price chart. The great resistance tested 9 time before and It is broken up a few days ago finally..
Here you can see daily logarithmic Hive price chart. There is downtrend line coming from the beginning of 2022 and It is tested to be broken up 7 times before..
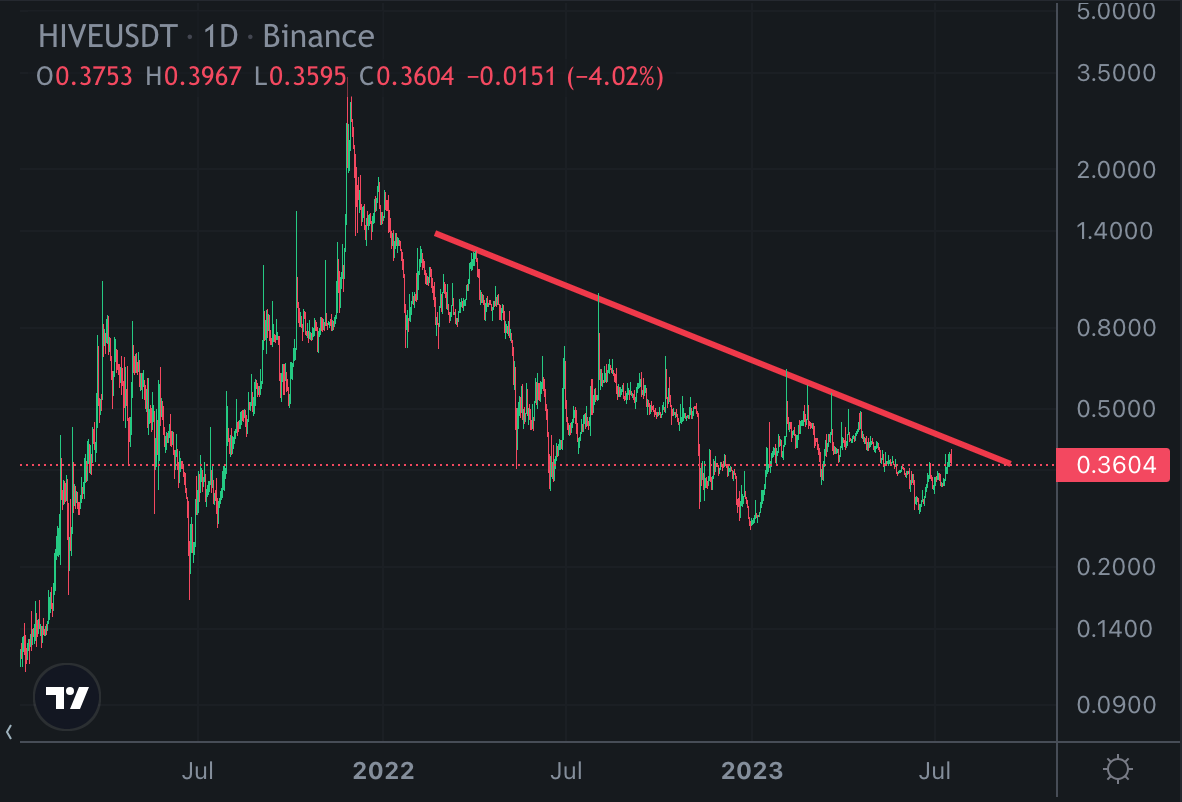
Hive is trying to break up this resistance for 8th times. Will it broke up ?
I think it may be early.
Here you can see weekly chart of Hive and there is support line on the chart. It will be crossed at the end of this year.
If Hive price breaks up this resistance in this month, It can be early. Because Hive will enter ultra mega bullish season after this breaking..
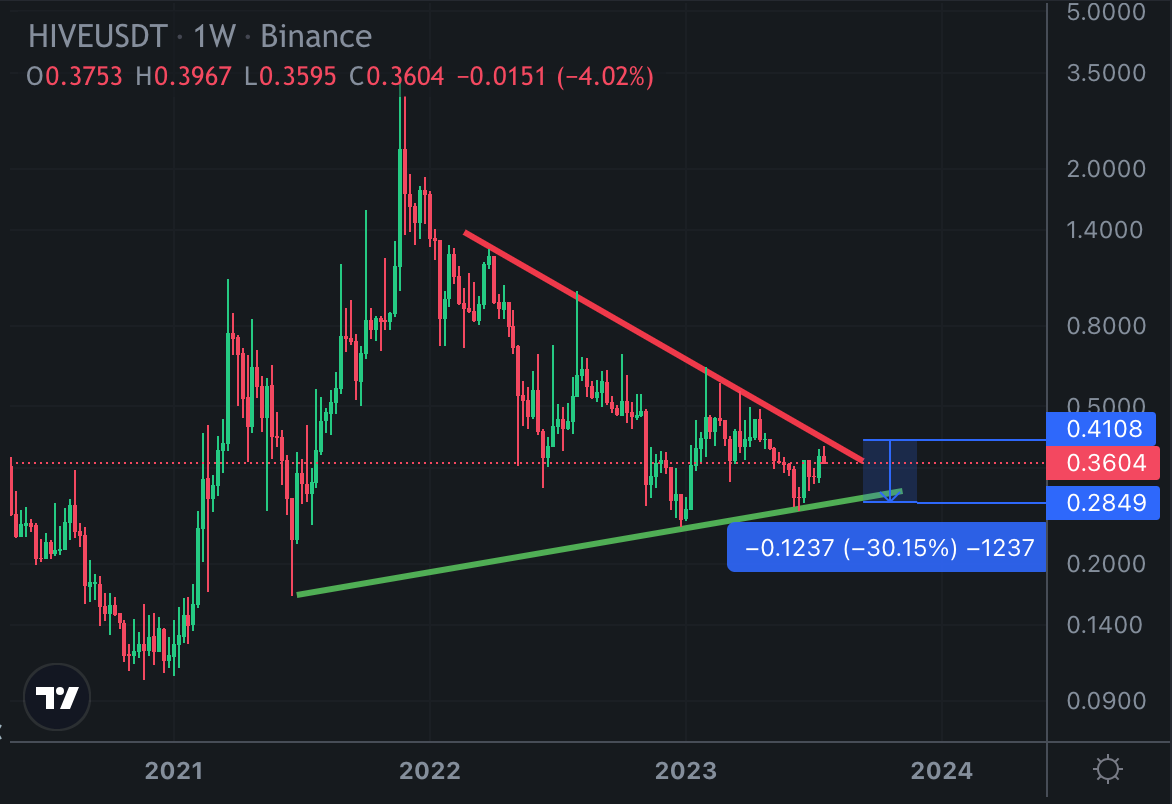
There is 50% range between support and resistance lines. We may see Hive price between this range for a few weeks or months..
We will see what will happen..
Posted Using LeoFinance Alpha
Hi, it looks great, i hope it would be green. Greetings from Germany