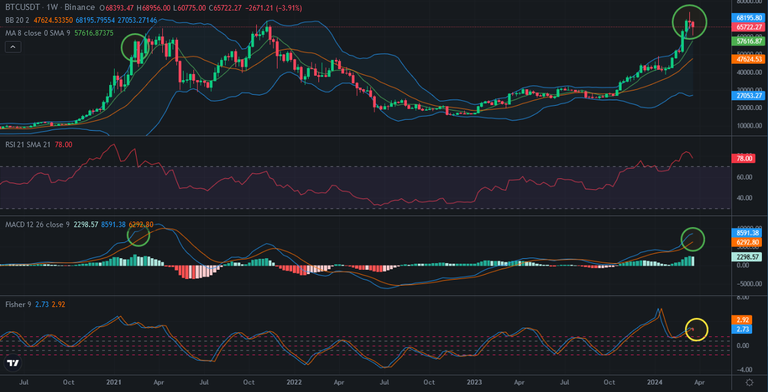
Bitcoin Price May be Close to Reserve in Weekly Chart
Today is the last day of the week. When we look at weekly Bitcoin price chart, possible price correction is coming soon. There are a few similarities between past and now. Bitcoin may draw same scenario.
Here you can see weekly chart of Bitcoin. We are 2nd red weekly candle in this week. It may be the beginning of price correction. Because Fisher Indicator in weekly chart is getting ready to reverse from the top. It means, Bitcoin price may enter price correction for a few weeks!
You can see what happened before when Fisher Indicator reversed from the top. MACD Indicator is also getting close to reverse from the top in weekly chart.
When we look at daily chart of Bitcoin, it supports our thesis. Daily Chart of Bitcoin has also entered price correction. There is downtrend line on Bitcoin price chart coming from 74K.
Fisher and MACD Indicators reversed from the top a few days ago and trying to reverse again for bullish move from the bottom. It may be early for bullish reversing. Bitcoin made correction on daily chart of Indicators but we need to see this correction on weekly chart of Bitcoin. It is important for long term bullish scenario of Bitcoin. If we want to see bullish trend until 2025, Bitcoin should enter price correction in weekly chart of Bitcoin.
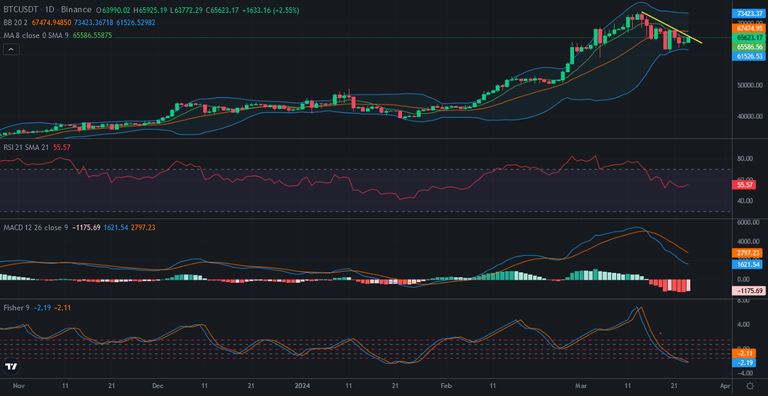
Halving is also coming soon. We may see huge price moves at the beginning of halving and It may cause price correction on Bitcoin.
We will see..
Posted Using InLeo Alpha
https://inleo.io/threads/chorock/re-chorock-2am2ovxig
The rewards earned on this comment will go directly to the people ( chorock ) sharing the post on LeoThreads,LikeTu,dBuzz.
Congratulations @chorock! You have completed the following achievement on the Hive blockchain And have been rewarded with New badge(s)
You can view your badges on your board and compare yourself to others in the Ranking
If you no longer want to receive notifications, reply to this comment with the word
STOPCheck out our last posts: