Bitcoin Price is Ready to Test All Time High
Bitcoin price is under consolidation for a month. Even It broke up all time high this year, Price correction was on the table and Bitcoin price went down from 74K to 60K. We can not say that it is a price correction or reversing of trend.
When we look at Bitcoin price chart, Bitcoin may restes all time high again.
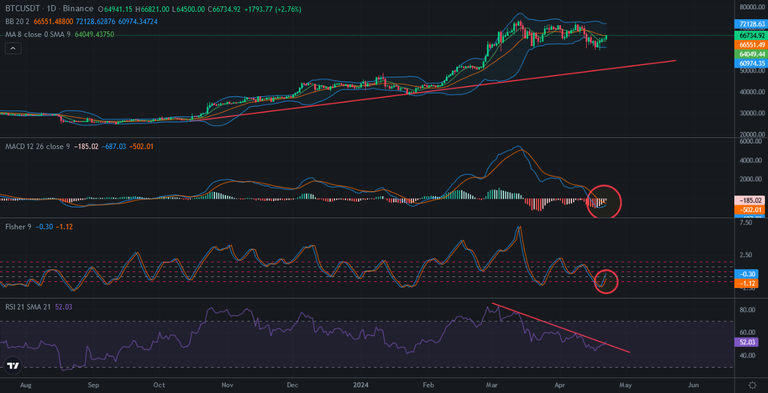
Here you can see daily chart of Bitcoin. MACD Indicator was all time high level. It entered correction. After a month correction is completed. MACD Indicator will reverse in a few days in daily chart. Fisher Indicator also reversed from the bottom.
There was a downtrend line on RSI Indicator. It is tested 3 times before and RSI Indicator broke up resistance. It means, mini bullish trend is coming soon!
Bitcoin may test again all time high after taking wind behind of it..
It is very important to see mini bullish Bitcoin price trend. If not, we may see worse days.
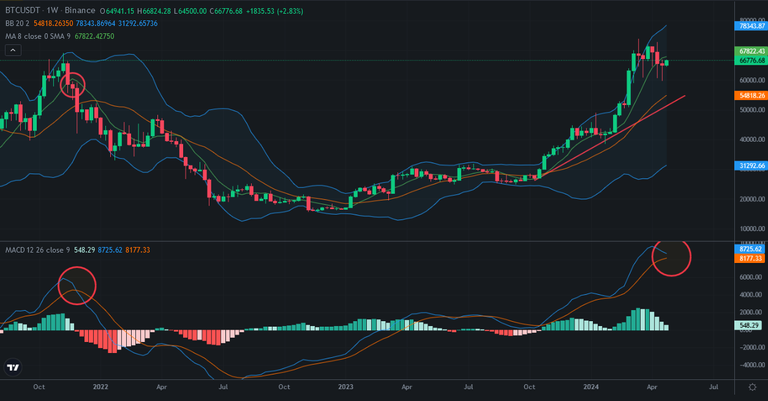
Here you can see weekly chart of Bitcoin. Bitcoin need a green weekly candle. After having 3 weekly red candles, Bitcoin should go up 8-week moving average. If not, you can see what happened before and what can happen..
MACD Indicator is getting ready to reverse in weekly chart. If it happens, price correction may take long time for Bitcoin!
This week will be decision for Bitcoin to enter long price correction or not. We should see green week in this week!.
We will see...
Posted Using InLeo Alpha
@tipu curate
Upvoted 👌 (Mana: 22/52) Liquid rewards.
This post has been manually curated by @bhattg from Indiaunited community. Join us on our Discord Server.
Do you know that you can earn a passive income by delegating your Leo power to @india-leo account? We share 100 % of the curation rewards with the delegators.
100% of the rewards from this comment goes to the curator for their manual curation efforts. Please encourage the curator @bhattg by upvoting this comment and support the community by voting the posts made by @indiaunited.