Bitcoin is Trying to Reverse to Go All Time High
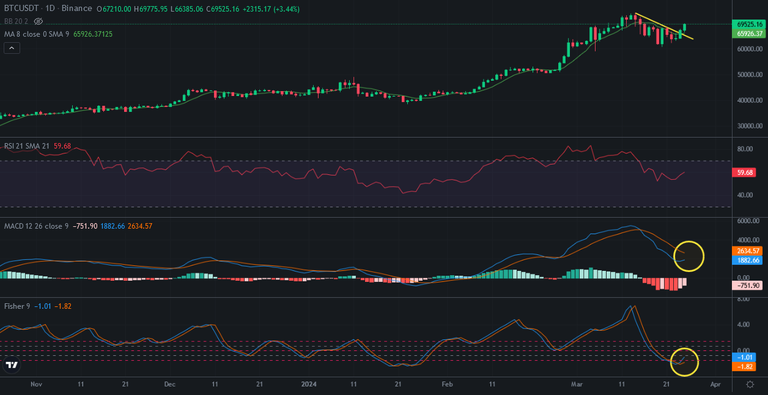
After going down from 74K to 62K, Bitcoin price tried to reverse to go up again. 62K was great support for Bitcoin for short term. There was downtrend line on Bitcoin price chart and it is broken up yesterday.
Here you can see daily chart of Bitcoin. The Indicators are trying to reverse. If it reverse we may see bullrun try. I circled the possible reverses. Fisher Indicator reverseed from the bottom. MACD Indicator need a few days to reverse on daily chart. If it reverses we may see all time high try..
This is bullish scenario for Bitcoin price chart.
Even Bitcoin price chart seems bullish, we should not forget to think it may be fake move.
Here you can see long term daily chart of Bitcoin price. I circled the same MACD Indicator level and move. It was a fake move when Bitcoin price went up to 69K in 2021.
Bitcoin drew same price move today. Bitcoin is trying to go up to all time high. If it happens, we may see price dump on Bitcoin price chart.
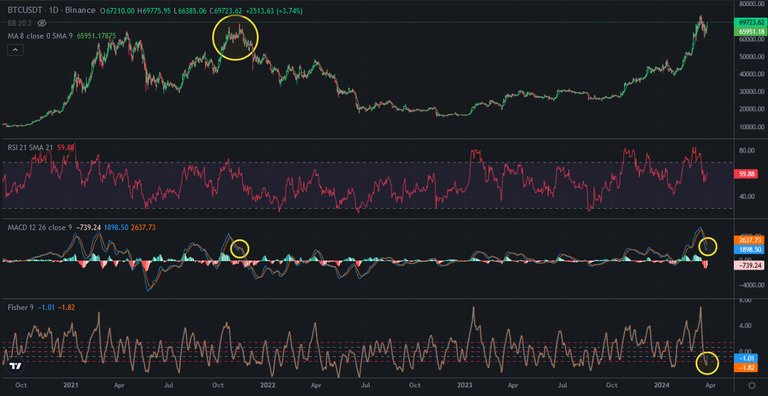
So, I think this is fake move on Bitcoin price chart. Bitcoin needs price correction. We should see this price correction for a few months.
I think we will enter with halving and it last sure until June.
We will see..
Posted Using InLeo Alpha
Posted Using InLeo Alpha
https://inleo.io/threads/chorock/re-chorock-ppxau1n2
The rewards earned on this comment will go directly to the people ( chorock ) sharing the post on LeoThreads,LikeTu,dBuzz.