Automate Your Trading Backtests To Get An Accurate Picture
If you are familiar with trading channels on YouTube, I'm sure you've seen claims of strategies that are 80% or even 99% profitable. That's highly unlikely unless they were trading with large stop losses and small take profits.
The Problem With Manual Backtesting
Many trading YouTubers provide some form of backtesting claim of their strategies. On the surface, this is good and probably better than the ones who don't back up their claims. There are two problems here:
- Inaccurate selection or non-selection of trades. Sometimes it is unintentional, but sometimes it is probably used to make their stats look better.
- Some repainting indicators don't show what the indicator would have looked like in real-time. Probably the best example of this is the Nadaraya-Watson indicator.
Automating The Backtest
Tradingview allows you to convert your indicator or group of indicators into a 'strategy'. You can then see how the strategy did historically based on your take profit and stop loss without any subjectivity.
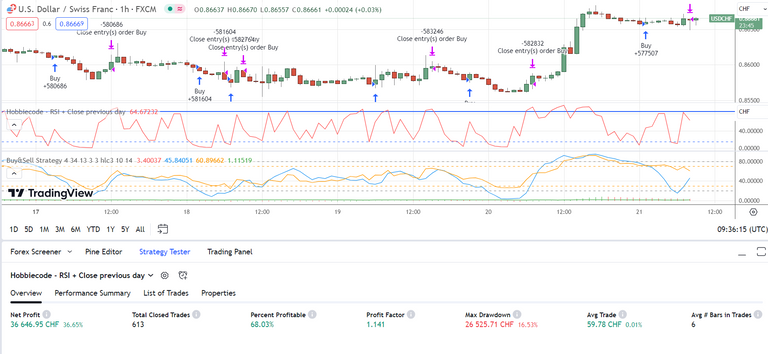
Here's an example using the Hobbicode + RSI as an example. You can see that it was a profitable strategy trading the USDCHF. It was 63% profitable based on over 600 trades with a profit factor of 1.14.
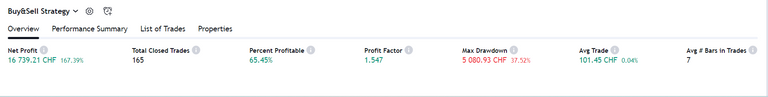
Another good strategy is the 'Buy & Sell Strategy' which is slightly less profitable but has a higher profit factor and lower drawdown.
Whichever strategy you use, automate your backtesting so that you can get a more accurate assessment of how well your alogrithmic rules perform in the market.
It might require some coding but it shouldn't be too hard if you already have a trading indicator to convert.